
Research papers are the foundation of scholarly and professional debate in today's quick-paced, information-driven environment. Effective writing abilities are not enough to produce a well-written and persuasive research paper; visual aids must also be used to improve the presentation and understanding of difficult information. Visual aids like graphs, charts, photos, and tables have the ability to present information and concepts in a clear and eye-catching way. They have a lasting impression on the readers in addition to making the text more accessible. The most effective methods and advice for including visuals in your research paper will be covered in this blog.
Whether you are a student striving to impress your professor, a researcher aiming to present your findings to a wider audience, or a professional seeking to communicate complex concepts in a simplified manner, the utilization of visual aids can significantly elevate the quality and impact of your work. Recognizing the importance of this aspect, many individuals and organizations turn to research paper writing services in India to receive expert guidance and support.writing
There are several possibilities available when looking for the best research paper writing service. India is one of the nations that has established a reputation for offering top-notch support, and there are several trustworthy research paper writing businesses there. These companies hire highly qualified individuals with the knowledge to effortlessly combine visual aids into research papers, improving the quality and efficacy of the latter.
Regardless of whether you use a research paper writing service or tackle the assignment on your own, we will explore the numerous best practices for including visual aids in your research paper in this article. You can write aesthetically beautiful and educational research papers that engage readers and clearly communicate your ideas by adhering to these rules.
So, whether you are a student, researcher, or professional, join us as we explore the best practices and tips for incorporating visual aids in your research paper. By the end of this blog, you will possess the knowledge and skills necessary to present your research in a visually engaging and impactful manner, leaving a lasting impression on your audience.
Benefits of visual aids in research paper
Visual aids in your research paper can significantly enhance its readability and impact. Here are some best practices and tips for effectively incorporating visual aids in your research paper:
How to implement visual aids in research writing?
The effectiveness of conveying information and data to readers in research papers can be significantly impacted by the use of visual aids such as graphs, tables, photos, diagrams, and charts. Depending on the study topic and the type of data, different forms of visual aids have specific advantages and disadvantages when it comes to communicating various sorts of information.
Tables are excellent for displaying vast amounts of data in an orderly and succinct manner, but graphs are effective at illustrating trends and patterns in quantitative data. Charts are excellent for comparing data across many variables or categories, while images and diagrams are useful for illuminating complex concepts or processes.
The choice of visual aid should depend on the specific research question and the type of data being presented. When using visual aids, researchers should also take their target audience's preferences and demands into account. For instance, highly technical or complicated visual aids may be suitable for a specialized audience but may be challenging for a general audience to comprehend.
Specific design principles that researchers should consider may vary across different disciplines and research topics. For example, in the natural sciences, visual aids may need to adhere to strict guidelines for data presentation, including the use of specific units of measurement or graphical formats. In the social sciences, visual aids may need to consider cultural or demographic differences in the target audience. In humanities research, visual aids may be less common but may include images or multimedia elements that support the analysis and interpretation of the research.
By offering a clear and simple depiction of data, findings, and concepts, visual aids can significantly improve the clarity and readability of research blogs. A well-designed visual aid can help readers remember important ideas and conclusions while also making difficult information more accessible and understandable.
Whether you are a student striving to impress your professor, a researcher aiming to present your findings to a wider audience, or a professional seeking to communicate complex concepts in a simplified manner, the utilization of visual aids can significantly elevate the quality and impact of your work. Recognizing the importance of this aspect, many individuals and organizations turn to research paper writing services in India to receive expert guidance and support.writing
There are several possibilities available when looking for the best research paper writing service. India is one of the nations that has established a reputation for offering top-notch support, and there are several trustworthy research paper writing businesses there. These companies hire highly qualified individuals with the knowledge to effortlessly combine visual aids into research papers, improving the quality and efficacy of the latter.
Regardless of whether you use a research paper writing service or tackle the assignment on your own, we will explore the numerous best practices for including visual aids in your research paper in this article. You can write aesthetically beautiful and educational research papers that engage readers and clearly communicate your ideas by adhering to these rules.
So, whether you are a student, researcher, or professional, join us as we explore the best practices and tips for incorporating visual aids in your research paper. By the end of this blog, you will possess the knowledge and skills necessary to present your research in a visually engaging and impactful manner, leaving a lasting impression on your audience.
Benefits of visual aids in research paper
Visual aids in your research paper can significantly enhance its readability and impact. Here are some best practices and tips for effectively incorporating visual aids in your research paper:
- Select the appropriate graphic aid: Make sure the visual aid you choose fits the data or information you are presenting. Visual aids that are frequently used include graphs, tables, pictures, diagrams, and charts.
- Ensure simplicity: Keep your visual aids from being overloaded with information. Use straightforward, understandable language and a standardized format to make sure they are simple to read and comprehend.
- Your visual aids with titles and labels: To give context and aid readers in understanding the purpose of your visual aids, make sure to clearly label and title them.
- Design and format your visual aids effectively: Use colors and fonts that are easy to read and provide contrast. Make sure your visual aids are high-quality and clearly visible.
- Effortlessly incorporate your visuals into the text: Make sure your visual aids are positioned next to the pertinent content and properly cited in the main body of your research report.
- Provide a description and analysis of your visual aids: Give a brief description and evaluation of your visual aids. In the body of your paper, give a succinct summary of your visual aids and analyze their value in light of your research question or hypothesis.
- Consider the ethical implications: Make sure your visual aids are accurate and do not misrepresent your data or information. Avoid manipulating visual aids to support your argument.
How to implement visual aids in research writing?
The effectiveness of conveying information and data to readers in research papers can be significantly impacted by the use of visual aids such as graphs, tables, photos, diagrams, and charts. Depending on the study topic and the type of data, different forms of visual aids have specific advantages and disadvantages when it comes to communicating various sorts of information.
Tables are excellent for displaying vast amounts of data in an orderly and succinct manner, but graphs are effective at illustrating trends and patterns in quantitative data. Charts are excellent for comparing data across many variables or categories, while images and diagrams are useful for illuminating complex concepts or processes.
The choice of visual aid should depend on the specific research question and the type of data being presented. When using visual aids, researchers should also take their target audience's preferences and demands into account. For instance, highly technical or complicated visual aids may be suitable for a specialized audience but may be challenging for a general audience to comprehend.
Specific design principles that researchers should consider may vary across different disciplines and research topics. For example, in the natural sciences, visual aids may need to adhere to strict guidelines for data presentation, including the use of specific units of measurement or graphical formats. In the social sciences, visual aids may need to consider cultural or demographic differences in the target audience. In humanities research, visual aids may be less common but may include images or multimedia elements that support the analysis and interpretation of the research.
By offering a clear and simple depiction of data, findings, and concepts, visual aids can significantly improve the clarity and readability of research blogs. A well-designed visual aid can help readers remember important ideas and conclusions while also making difficult information more accessible and understandable.
Incorporating visual aids into study papers can also lead to certain common errors made by researchers. Some examples of these errors are:
To ensure that their visual aids accurately represent their data and information, researchers should take the following steps:
Now, when we are talking about the visual aids and research paper writing, it’s also important to know about your dissertation revision or the revision of your research paper. Now, let’s go to the next point.
- Overloading the visual aid with too much information or data can make it difficult to read or interpret.
- Choosing inappropriate or inconsistent formatting, which can detract from the readability and professionalism of the research paper.
- Failing to clearly label and title visual aids, can make it difficult for readers to understand their purpose or significance.
- Including visual aids that are not directly relevant or essential to the research question or findings, which can distract from the main points of the paper.
- Using visual aids that are too complex or technical for the target audience, can lead to confusion or misinterpretation.
- Not explaining or interpreting visual aids adequately in the text of the research paper, can leave readers unsure of their significance or meaning.
To ensure that their visual aids accurately represent their data and information, researchers should take the following steps:
- Ensure that the data used in the visual aid is accurate and reliable. This can involve double-checking data sources, validating data through statistical analysis, and consulting with experts in the field.
- Choose the most appropriate visual aid format for the data being presented. Different types of data require different types of visual aids, such as graphs, charts, tables, or images.
- Ensure that the visual aid is clear and easy to understand. This can involve testing the visual aid with a sample audience, soliciting feedback, and revising the visual aid as needed.
- Provide context and explanation for the visual aid within the text of the research paper. This can help readers to understand the purpose, significance, and limitations of the visual aid.
Now, when we are talking about the visual aids and research paper writing, it’s also important to know about your dissertation revision or the revision of your research paper. Now, let’s go to the next point.

Integrating visual aids seamlessly into the text of a research paper can help to enhance the clarity and readability of the paper, as well as reinforce key concepts and findings. Here are some effective strategies for integrating visual aids into the text:
In order to effectively convey complicated scientific ideas to a public audience, visual aids can be crucial. This is so that abstract ideas can be made more concrete and tangible. Visual aids can frequently convey information more effectively and clearly than words alone. Additionally, visual aids can be employed to make the audience's experience more memorable and engaging, which can improve their comprehension and retention of the information.
It's crucial to remember that not every audience member will be familiar with the subject being covered when developing visual aids for a general audience. As a result, visual aids must be created such that even individuals with little or no prior knowledge can access and understand them.
- Refer to the visual aid in the text: When referencing a visual aid, researchers should explicitly refer to it in the text and provide a brief explanation of what the visual aid is showing. This can help to orient readers and provide context for the visual aid.
- Place the visual aid near the relevant text: To avoid distracting readers, visual aids should be placed near the relevant text that discusses the data or information presented in the visual aid. This can help readers to understand the relationship between the visual aid and the surrounding text.
- Use clear and concise captions: Captions should be used to describe the visual aid and provide additional context or explanation. Captions should be concise and provide all the necessary information without overwhelming the reader.
- Use a consistent format for visual aids: To avoid confusion, visual aids should be presented in a consistent format throughout the research paper. This can include consistent fonts, colors, and labeling conventions.
- Test the visual aids with a sample audience: To make sure the visual aids are clear and effectively communicate the desired information, researchers should test them with a sample audience. The visual assistance can be modified to assure its effectiveness using feedback.
- Journals: Journal blogs typically have strict formatting requirements, including limitations on the number and size of visual aids. To meet these requirements, researchers may need to carefully choose which visual aids to include, and optimize the visual aids for size and clarity.
- Conference proceedings: Conference proceedings may have more lenient formatting requirements than journals, but researchers may need to consider the timing of their presentation when incorporating visual aids. For example, visual aids that are difficult to read or understand quickly may not be effective in a conference setting.
- Theses: Theses may have more flexibility in terms of formatting and visual aids, but researchers may need to consider the audience for the thesis. Visual aids that are appropriate for a specialized academic audience may not be as effective for a broader audience.
In order to effectively convey complicated scientific ideas to a public audience, visual aids can be crucial. This is so that abstract ideas can be made more concrete and tangible. Visual aids can frequently convey information more effectively and clearly than words alone. Additionally, visual aids can be employed to make the audience's experience more memorable and engaging, which can improve their comprehension and retention of the information.
It's crucial to remember that not every audience member will be familiar with the subject being covered when developing visual aids for a general audience. As a result, visual aids must be created such that even individuals with little or no prior knowledge can access and understand them.
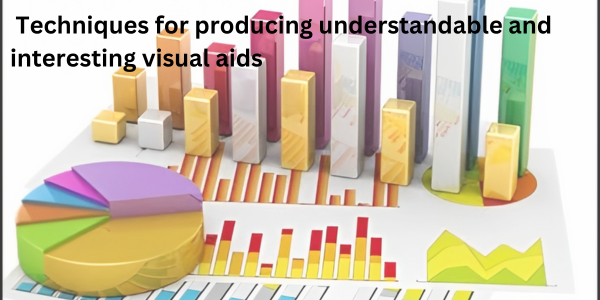
Some techniques for producing understandable and interesting visual aids include:
Thank you for reading this blog.
- Ensure simplicity: Try to use language that is simple to grasp and avoid using jargon or technical terms.
- Use crisp, high-resolution images: Visual aids ought to be of the highest quality, easily readable, and aesthetically pleasing. This can be done by employing simple charts and graphs, high-resolution photos, and fonts that are easy to read.
- Identifying important points: Use visual aids to draw attention to important ideas and points and to assist the audience in drawing connections between various bits of information.
- Use a variety of visual aids: There are various ways to present information using different visual aids. Among other things, this can involve the use of graphs, charts, pictures, and videos.
- Examine your visual aids: Test your visual aids on a few non-experts to acquire their comments on their clarity and efficacy before presenting them to a general audience.
Thank you for reading this blog.
 RSS Feed